
Who Is Actually Liking Your LinkedIn Posts in 2026?
We analysed who engages with your LinkedIn posts: 7,474 LinkedIn post reactions and comments sorted by job title. Only 25% are B2B decision makers.

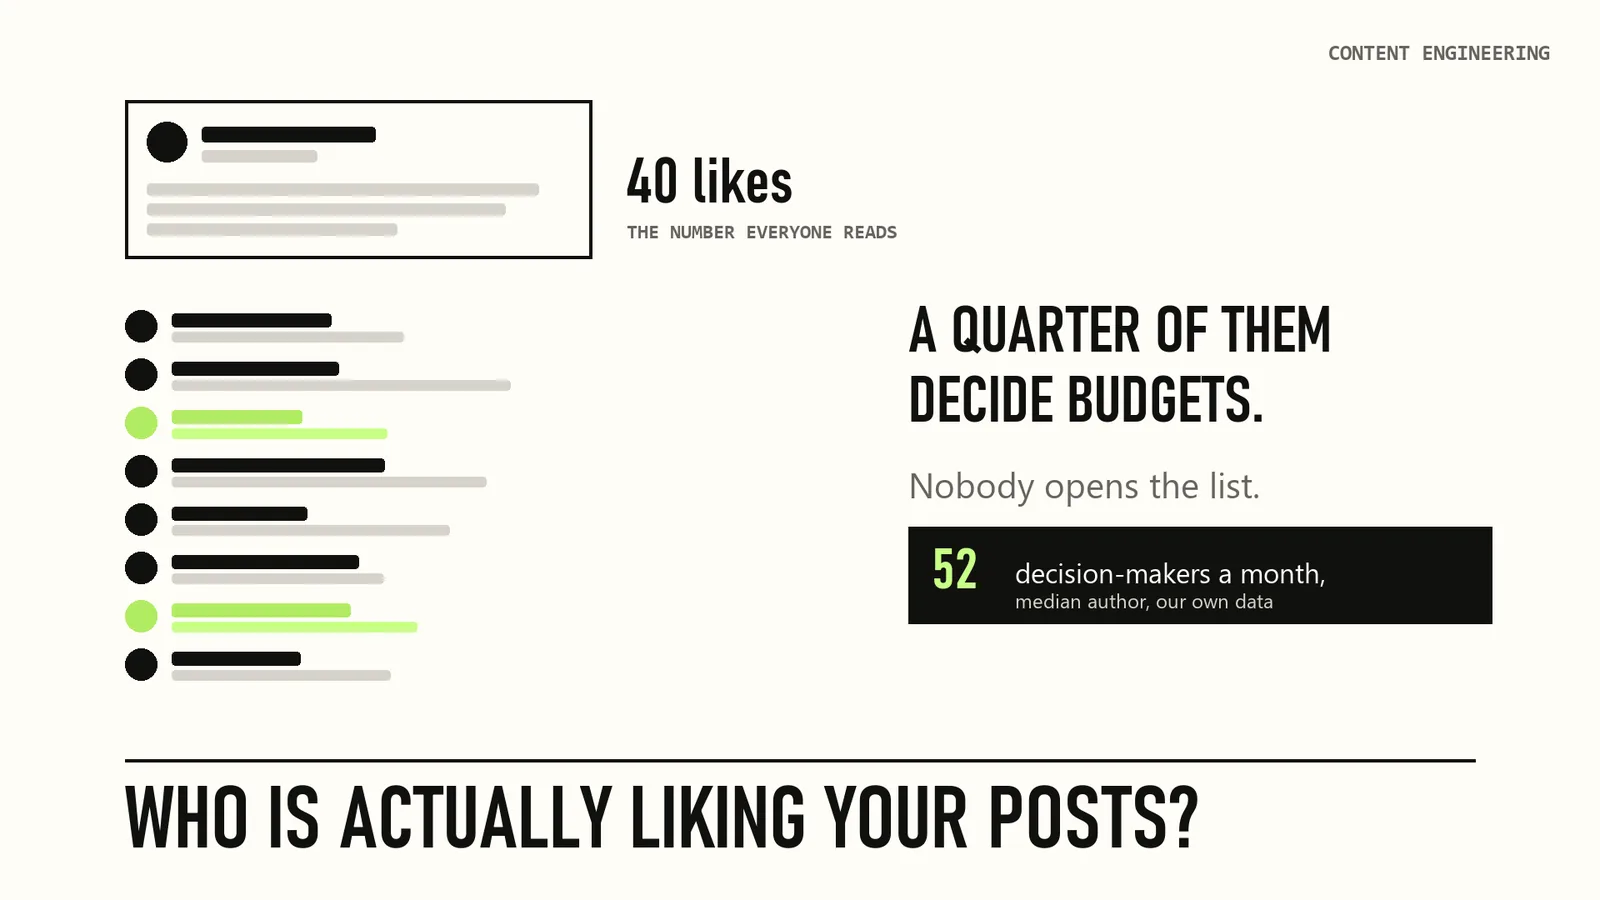
Last month a founder told me he had stopped looking at reactions. "Forty likes, mostly people I know. It tells me nothing." He was half right. The number tells you nothing. The list underneath it is a different story.
We pulled every reaction and comment under 258 posts published in the last 30 days by 26 B2B authors, including my own feed. That is 7,474 people, each one arriving with a job title attached. Then we sorted them by who they are.
A quarter of them hold a decision-making title. Almost as many are there to sell you something. And the people you would most want to talk to are the ones who say the least.
In this article
- The number nobody opens
- How we measured
- Finding one: a quarter buyers, a fifth sellers
- Finding two: the quiet ones are the buyers
- Finding three: reach makes the room worse
- Finding four: the return visitors
- Finding five: your audience is your own
- What the titles do not tell you
- The conclusion
The number nobody opens
A like is the cheapest currency on LinkedIn, which is why everyone treats it as noise. The reasoning goes: reactions are vanity, comments are engagement, replies in the DM are business. Optimise for the bottom of that ladder and ignore the top.
The problem with that reasoning is that it describes actions, not people. A reaction is an action worth nothing. But the person who performed it is worth exactly as much as they were before they clicked, and LinkedIn shows you their name and their title for free.
Nobody opens the list. In dozens of conversations with founders over the past year, I have met two who regularly read the names under their own posts. Both of them run outbound teams.
So we opened the lists at scale and counted what is inside.
How we measured
The method is deliberately boring:
- Twenty-six authors: nine marketing leaders under 10,000 followers, nine between 10,000 and 50,000, seven above, plus my own account. All of them publish regularly, so none of the samples are built on a single lucky post.
- Every post they published themselves in the 30-day window, up to ten each. Reposts and posts where they were merely tagged were removed, because the audience of those belongs to somebody else. That cleaning step alone removed 12% of what the feed reported as their posts.
- Every reaction and every comment under those posts, with the job title our system captures for each person: 258 posts, 10,215 reactions, 2,526 comments and 1,288 replies inside comment threads.
- Each person sorted by title into six groups: C-level, senior leaders (VP, head of, C-level), managers, specialists, people selling services, and job seekers.
Two definitions matter. Decision-maker means C-level or a senior leader, and it is a statement about a job title, not about intent to buy. Selling to you covers consultants, agencies, coaches, fractional executives and anyone whose title is a pitch, because a fractional CMO is technically C-level and is not a buyer.
That last group needs its own note, and I will come back to it, because sorting people by what they call themselves turns out to be its own finding.
Finding one: a quarter buyers, a fifth sellers
Here is the whole audience, 7,474 people:
- Specialists and individual contributors: 41.9%
- People selling services: 21.2%
- C-level: 14.4%
- VPs and heads of function: 10.8%
- Managers: 8.3%
- Job seekers and unclassifiable: 3.4%
25.2% hold a decision-making title. 21.2% are there to sell.
For every buyer in the room there is very nearly one competitor for the room's attention.
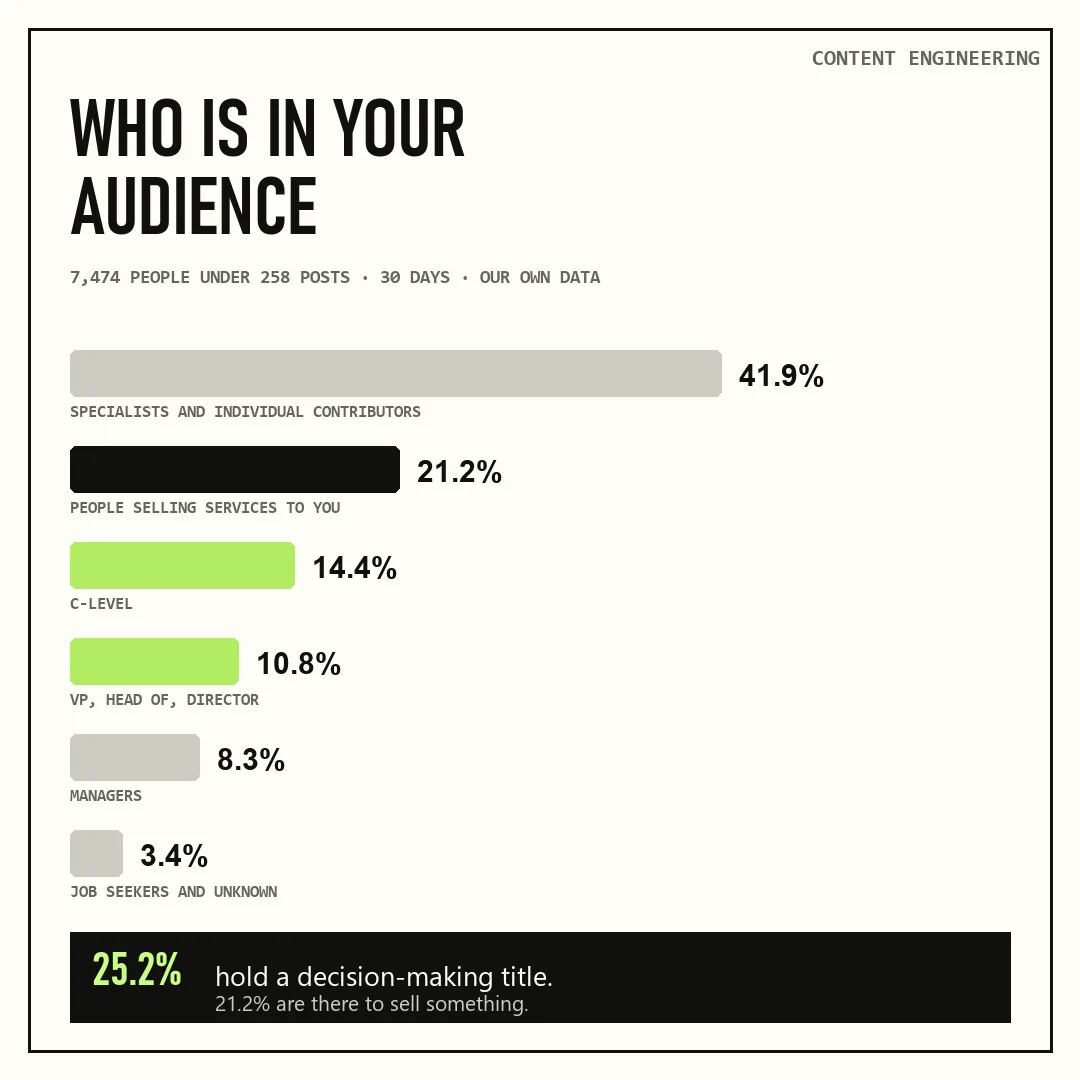
Every person who reacted or commented under 258 posts in 30 days, sorted by title.
The one-to-one ratio between buyers and sellers is the part worth sitting with. It means half of what looks like market interest is other people working the same room you are working. It also means the raw engagement number on a post is a poor proxy for anything: two posts with 100 reactions each can differ by a factor of five in how many decision-makers they reached.
In absolute terms the picture is friendlier than the percentages suggest. The median author in our sample had 52 people with a decision-making title pass through their feed in 30 days. Under 10,000 followers the median is 15; above 50,000 it is 87. My own feed had 107.
Fifty-two named executives a month is not a rounding error. It is more qualified people than most B2B founders reach through outbound in the same period, and it arrives with no cost, no sequence and no reply rate.
Finding two: the quiet ones are the buyers
Engagement is usually pictured as a ladder. A like is the bottom rung, a comment is better, a reply inside a thread is better still. Climb the ladder and the quality improves.
We tested that by splitting the same audience by the deepest action each person took.
- Liked and said nothing, 5,769 people: 24.4% decision-makers, 18.9% selling to you
- Left a comment, 1,434 people: 26.9% decision-makers, 29.1% selling to you
- Replied inside a thread, 178 people: 28.7% decision-makers, 28.7% selling to you
The share of decision-makers barely moves: 24.4% to 28.7% across the whole ladder. The share of people selling services jumps by half the moment somebody opens their mouth, from 18.9% to 29.1%.
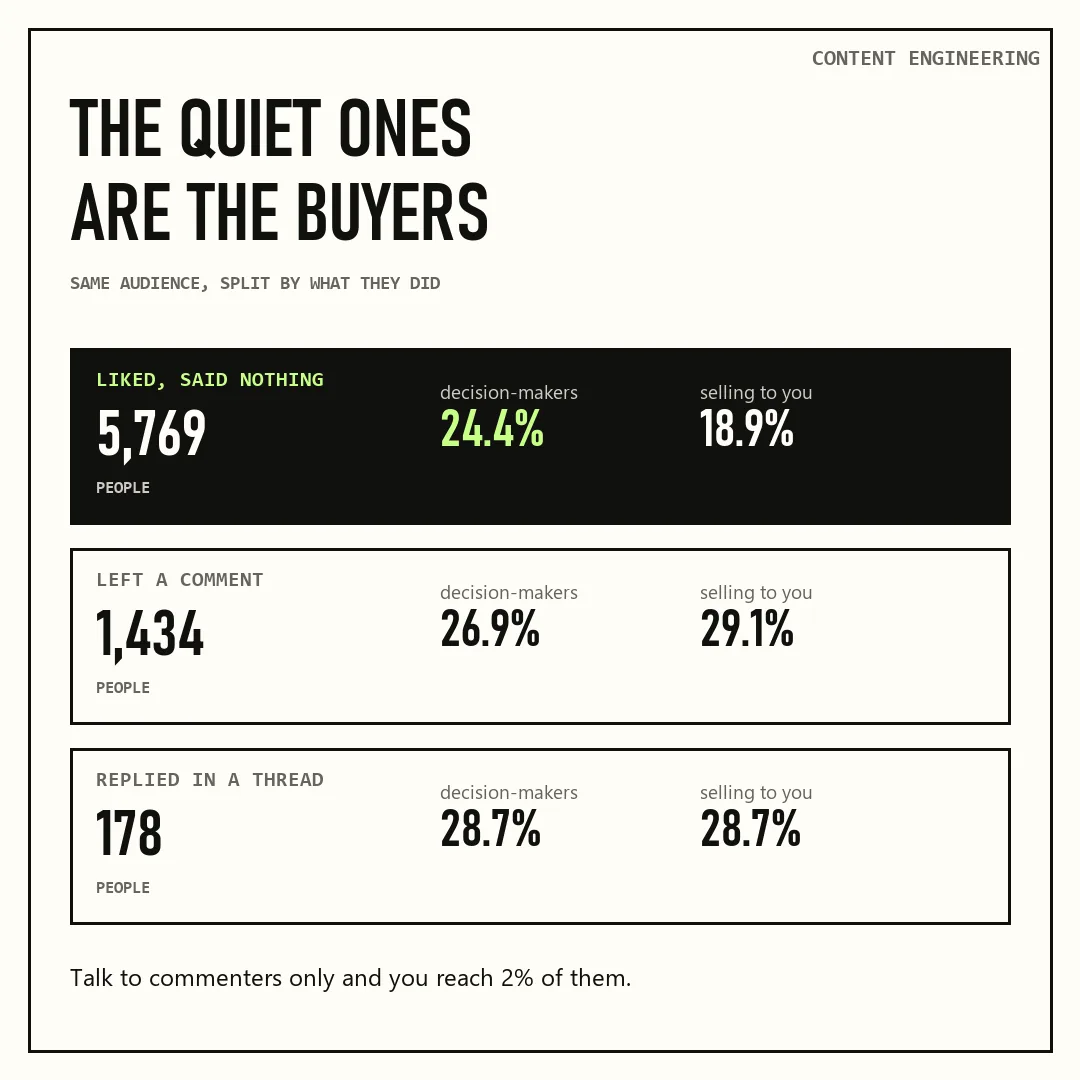
Same audience, split by the deepest action each person took.
Read the absolute numbers and the point sharpens. Roughly 1,400 of the decision-makers in our data did nothing but like a post. Fifty-one of them made it as far as a conversation in a thread. An author who works only with commenters is working with 2% of the executives who read them, and with the slice where competitors are densest.
This is not an argument against replying in comments. It is an argument against using comments as your read on who is out there. The comment section is where people who need visibility go to work. Buyers mostly scroll, sometimes click, and leave a trace one pixel wide.
Finding three: reach makes the room worse
If a quarter of your audience are decision-makers, the obvious move is to make the audience bigger. We checked whether that works by comparing every post in the sample by size of audience against quality of audience.
It goes the wrong way. The correlation between how many people a post reached and the share of decision-makers among them is −0.20. The top quarter of posts by reach (median 126 people) carried 21% decision-makers. The bottom quarter (median 15 people) carried 26%.
The mechanism is not mysterious. A post that travels does so because it appealed to a general audience: it was funny, or angry, or about the platform itself. A post that reaches fifteen people reached the fifteen who care about the specific thing you said. Our previous issue measured how often posts break out beyond their author's usual numbers; this one measures who shows up when they do, and the answer is that the extra people are, on average, less relevant than the ones you already had.
For a founder deciding where to spend an hour, that reframes the question. A post that lands 20 reactions from the right 20 people is not a failed post.
Finding four: the return visitors
One touch means very little. In our data 78.8% of people appeared under exactly one post and never came back inside the month.
The other 21.2% came back. Among those repeat readers, 406 hold a decision-making title. That list is short, specific, and behaves nothing like the rest of the audience: these are people who saw the author's name, recognised it, and stopped again.
We pulled full profiles for every one of them to see what sits behind the titles. The companies are real: Contentful, Salesforce, Dataiku, Diageo, Coca-Cola HBC, Vultr, Pax8, VAST Data, Goldman Sachs, Rocket Mortgage, Appriss Retail, Storylane. By geography, 247 are in the United States, 33 in India, 25 in the UK, and the rest spread across Europe and the Gulf.
One pattern in that list deserves its own section, because we did not expect it. People do not arrive alone. They arrive with colleagues.
Sorting the repeat readers by employer, the same company names come back several times over:
- Contentful, five people: VP of enterprise sales for the Americas, head of enterprise sales for US West, director of global events and brand, and two more
- The 20 MSP, five people: the founder and CEO, the SVP of sales, the creative director
- Appriss Retail, five people: a VP of professional services, a director of product management, a senior art director
- Vultr, four people: the chief operating officer, the VP of strategic engagement, the director of developer relations
- Zensai, four people: the CEO, an SVP of corporate strategy, the head of community marketing
- Storylane, three people: the founder and CEO, the head of demand generation, the head of brand
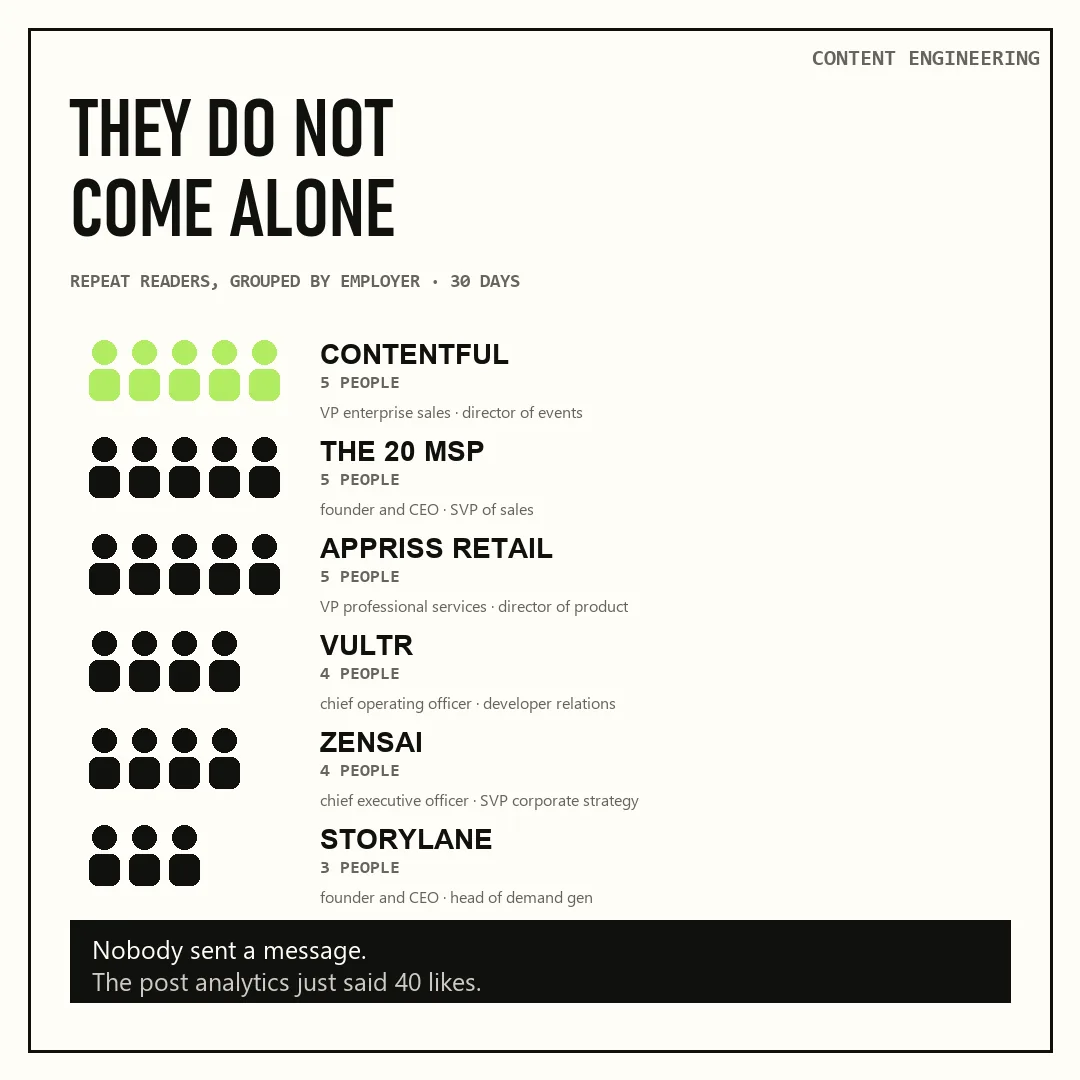
Repeat readers from the same employer, inside one 30-day window.
Nobody at Contentful sent a message. Nothing in the author's analytics says "Contentful is paying attention." The reaction count says 40, then 55, then 38. Underneath, half a sales organisation has been reading for a month.
A single executive reading you is a person with an interest. Three of them from the same company inside 30 days is an account with a conversation happening somewhere off the platform. In outbound terms this is the signal teams pay data vendors for, and it is sitting in a list LinkedIn shows for free to anyone who clicks the reaction count.
It also explains why the median of 52 decision-makers a month undersells the case. Those 52 are not 52 unrelated leads. They cluster into a much smaller number of companies, and the clusters are where the actual opportunities are.
Finding five: your audience is your own
The last question we asked was whether all this could be shortcut. If a defined group of buyers reads a predictable set of influential people, then the efficient move is to get in front of those people rather than build your own audience.
So we took 250 executives across marketing, engineering and revenue, and tracked everything they liked and commented on for 30 days: whose posts do they actually read?
They read 12,183 different authors. The single most-read person in the marketing segment was seen by nine of the 149 marketing executives. Six percent. After that the list drops immediately to sevens and sixes.
There is no set of voices that the market reads. There are twelve thousand authors, each read by a handful of people.
The same isolation shows up inside our own sample. Of the 7,199 people who engaged with the 26 authors, 98.4% appeared under exactly one of them. Twenty-six authors in overlapping niches, publishing to the same professional world, and their audiences barely touch.
Which turns the earlier findings from an observation into an argument. If there is no shared room to walk into, then the several dozen executives who arrive under your own posts every month are not a sample of the market you could reach elsewhere. They are the access you have.
What the titles do not tell you
Everything above rests on job titles that people write about themselves, so we checked how much that can be trusted.
For all 402 repeat decision-makers we pulled the full profile and compared the headline against the current position in their work history. The two agree 84% of the time.
The 16% that disagree are instructive. "Founder, EnigmaCoder | AI Developer & Data Scientist" works as a self-employed data scientist. "Content Creator | Brand Marketer | Storyteller" is a pharmacist at a university. "3X Founder" practises law. The error runs both ways: 21 people turned out to hold a more senior role than their headline advertised.
So the honest version of our headline number is this: about a quarter of the audience presents as decision-makers, and roughly five in six of those hold up when you check their work history. Sorting by headline gets you most of the way; it does not get you all the way, and anyone building a list this way should verify before they act on it.
Two more limits. Our 26 authors are marketing leaders and a founder, so the audiences skew toward marketing; an engineering audience will be shaped differently. And a title is not intent. Nothing in this data says any of these people want to buy anything. It says they read you.
The conclusion
Three numbers hold this issue together.
A quarter of the people under your posts hold a decision-making title, and a fifth are selling. Roughly three quarters of those decision-makers never write a word, which means the comment section shows you the least representative slice of your own audience. And the market has no shared audience to borrow: 98.4% of the people who read one author in our sample read none of the others.
The list under your last post is the most qualified audience you have direct access to, and it is the only marketing asset that regenerates weekly whether or not anyone looks at it. Most people do not look.
We measure this for B2B founders every week: who is in your audience, which of them come back, and what your own baseline looks like. DM Sergey or visit cccrafts.ai.
Content Engineering is a newsletter by cccrafts. We build and run content systems for B2B companies.
Serge Bulaev is the CEO and founder of cccrafts, where the team builds and runs content systems for B2B companies. He writes Content Engineering, a newsletter about the data, automations and costs behind content that reaches the right buyers.