
How Do You Prove LinkedIn Content Is Working in 2026?
LinkedIn attribution fails because buyers never click. Measure account coverage instead: which target accounts touched your content, and how often.

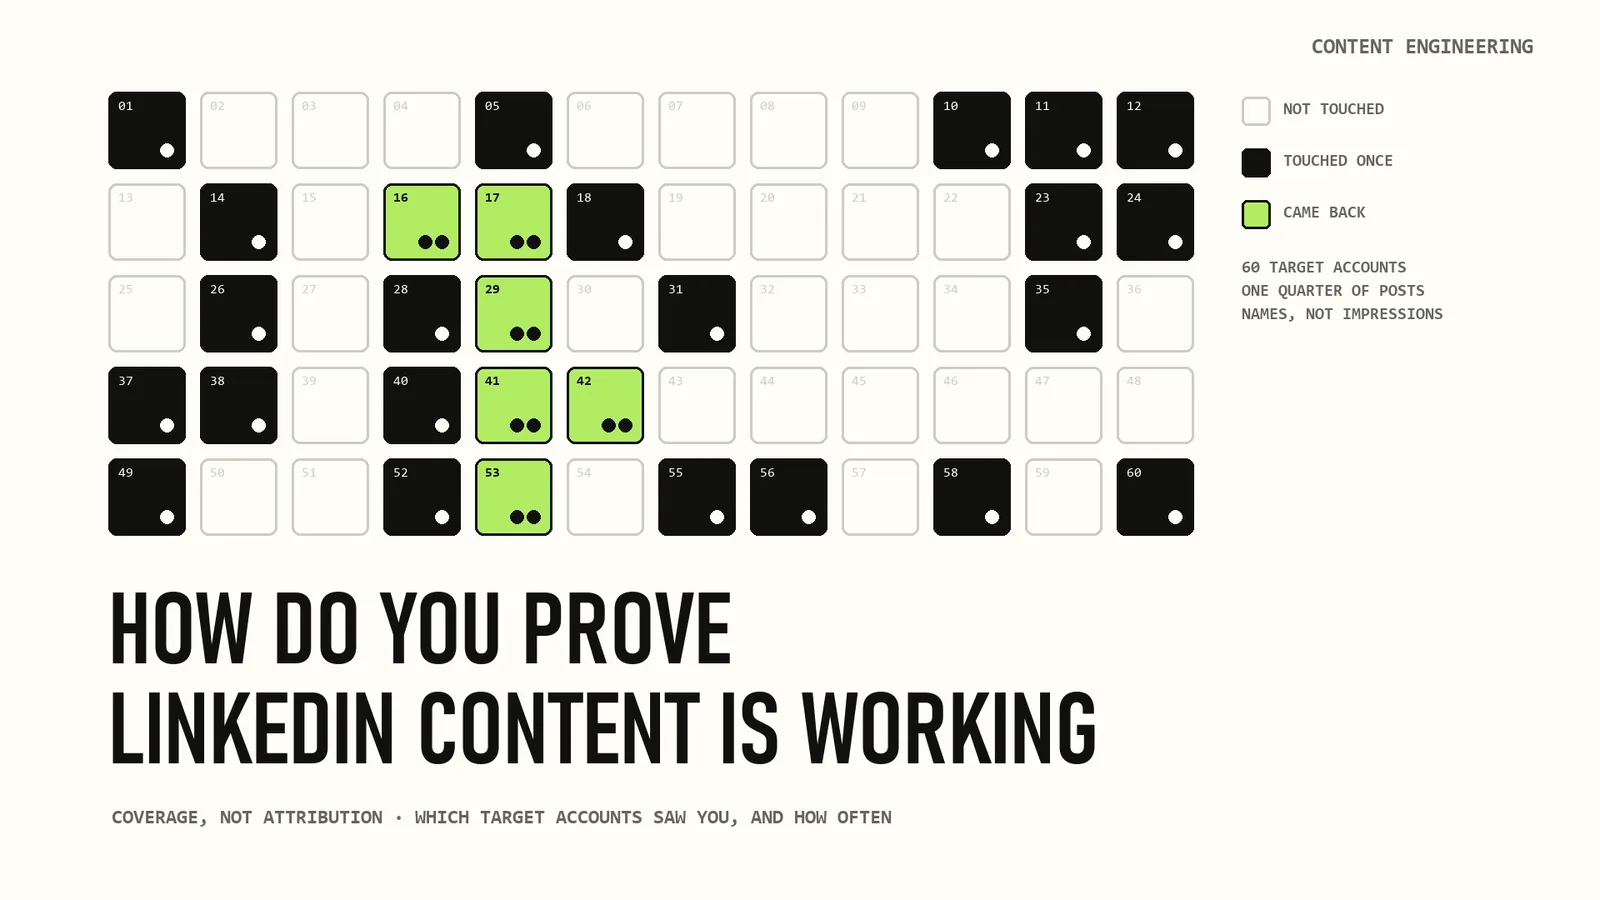
Every marketing leader I talk to has the same month. The posts go out, the agency sends a report, the report has impressions, reach, follower growth and an engagement rate. Then the CEO or the CFO asks what any of it did for the business, and the room goes quiet.
That silence is why LinkedIn is the first line cut when budgets tighten. The work is often good. The defence is missing.
We sent reports like that too. Ours had impressions per author, posts per month, reactions per post. It was honest and useless in a budget meeting, because it answered a question nobody in finance was asking. Then a customer asked me something else: who from our ICP liked the posts you wrote? For me this is already more of a business metric. This issue is the long answer to that question.
The short answer is that you already have the data. Every like and every comment under your posts is a signal with a name attached, and names can be matched to the accounts you sell to. The rest of the article walks that idea to a report finance will accept: why attribution cannot get you there, what LinkedIn shows instead of clicks, what that looks like on real accounts, the four numbers that go in the report, how to build them and how to defend them. By the end you will have the report and the first afternoon of work to produce it, with or without our tools.
If you are the CEO rather than the CMO, read it as the report to ask for.
In this article
- Attribution is never coming
- The question that has an answer
- What the list looks like when you pull the names
- The year nobody looked at
- Four numbers
- Building it
- The three objections you will get
- What you must not claim
- Your first month, without buying anything
- What we do with this
Attribution is never coming
The instinct is to fix the report by improving attribution. It will not work here. Knowing why saves you a quarter.
Your buyer does not click. In our own measurement of 258 B2B posts and the 7,381 people who touched them, three buyers out of four only ever pressed like. They read, they recognised the name, they moved on. No click, no UTM parameter, no session. Any system that waits for a click cannot see them.
The people who do click arrive months later through a search for your brand, and last-touch attribution hands all the credit to that search. The "how did you hear about us" field is filled in by a minority and filled in badly. And the cycle is long. I see it in my own business: in B2B a lead sometimes takes a year to come to you.
There is one more problem, and it is structural. Impressions, the number every report is built on, are visible only to the account owner. They are not in any API, and nobody outside the company can check them. Every other number on LinkedIn is public.
You are trying to prove causation in a channel where the buyer deliberately leaves no trace. Pick a different question.
The question that has an answer
The different question is this: which of our target accounts did content reach, and how often? Attribution asks what content caused. Coverage asks who content reached. The second question can be answered from public data, and that is the whole reason it works.
That is coverage. Account-based marketing has reported it for years, and finance accepts it because it counts accounts, the unit finance already uses. Sales accepts it because it names companies they already have in the pipeline.
LinkedIn is unusually generous here. Every reaction and every comment is public and signed. A like is a signal that a person saw you and reacted. A comment is a stronger one. Both carry a name. Open the list under any post and you get those names. From a name you get a title and a company. So the output of a post is not a number, it is a list of people you can match against your target account list.
Most teams never open that list. It refreshes every time you publish, it costs nothing, and nobody reads it. One client of ours did open it. He looked at a post with 35 likes and said: these three, only these matter. He was reading names, and the report was giving him counts.
Before this becomes a metric, you need to see that the list is real and that it sorts. Two cases: one stranger, one client.
What the list looks like when you pull the names
The first case is a study we ran on one executive, a chief growth officer at a global consumer goods company. Not a client, a person we wanted to understand.
We took her last 20 posts and pulled everyone who reacted or commented: 900 unique people, 1,444 separate signals. Then our system looked up every one of the 900 and sorted them by what you would do with them.
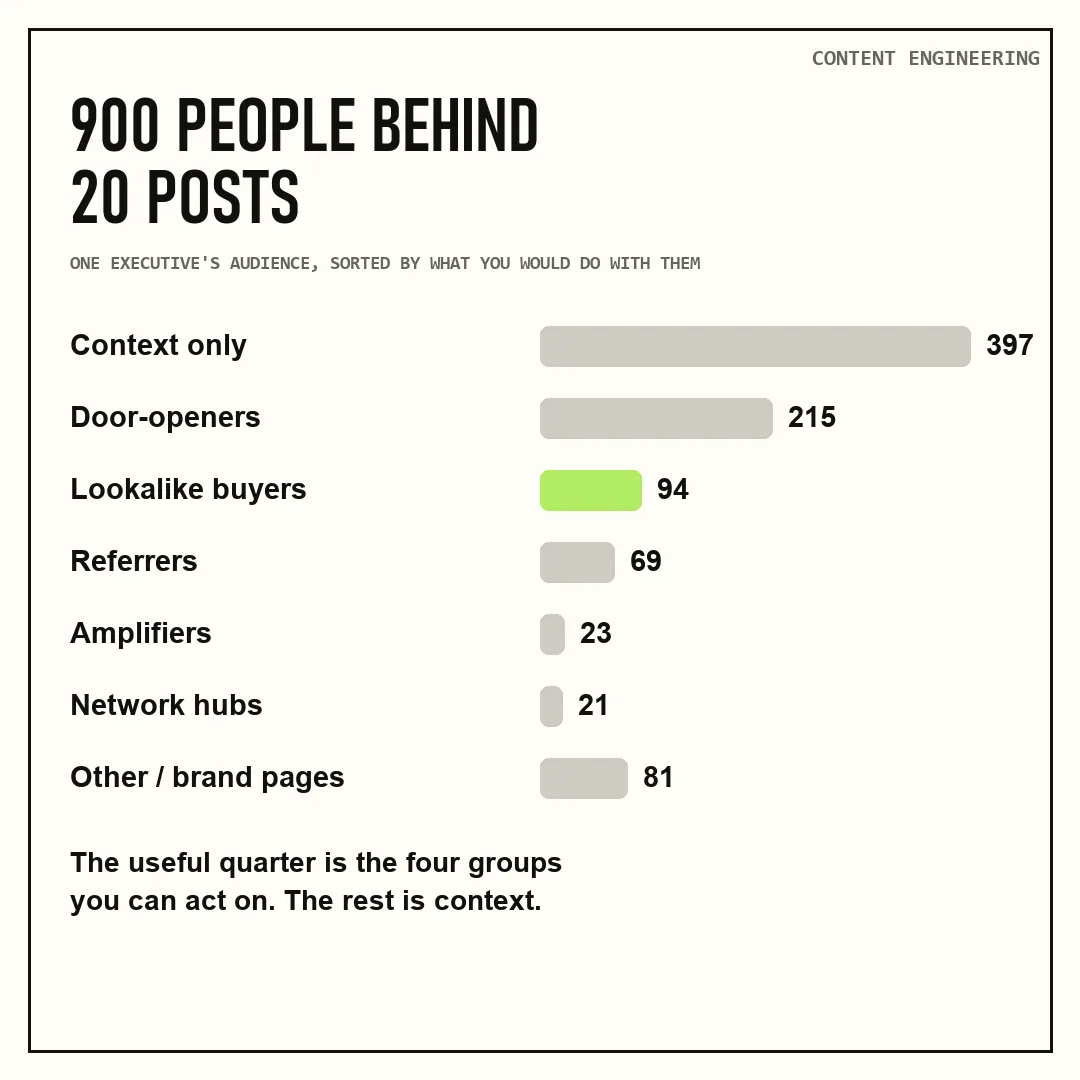
900 people behind 20 posts, sorted by who they are. Our own data.
A little under half were context: peers, curious strangers, people who like everything. The other 503 were people you can act on. 94 were marketing executives with her own profile, already interested in her subject, already self-selected by showing up. 215 were agency and creative leaders who each sit next to dozens of executives like her. The rest were coaches, press, community leads, founders and vendors.
None of that came from a survey or a data vendor. It came from the like list under 20 posts. The proportions are hers alone; a founder selling to logistics companies would get a completely different split. What does not change is that the list has names on it, and names can be sorted.
That was a stranger's audience, sorted by who the people are. The next step is the one that matters for the report: take the same list for a client and match it against the accounts the client sells to.
The year nobody looked at
The second case is a client we run content for. This one changed how we report.
A B2B software company had been publishing on LinkedIn for a year. Good posts, consistent cadence, a monthly report that looked like everyone else's. We took the whole year of engagement, everyone who had liked or commented on the founder's posts, and matched it against the company's own target account list. About 2,500 people had engaged. 780 of them worked at companies on that list.
Seven hundred and eighty named people, at accounts the sales team was already trying to reach, who had raised a hand in public at least once. Nobody had ever opened the list. And then the question: why did we do nothing with this?
We have since found the same gap in other shapes, at other clients. At one, sales had built a cold list of nearly 5,000 contacts for an executive's outreach. We crossed it with the people who already engaged his posts. The overlap was zero. Five thousand strangers, and not one of the people who were already reading him. At the same company, 153 employees of one target account had engaged the firm's content over a year, almost all of it through a single executive. The executive formally responsible for that account had published once in twelve months. He had 25 engagers, and none of them were from the account. That one is a content problem. Only the measurement made it visible.
Every client's numbers are their own. 780 out of 2,500 is one company, one year, one list. Another client, a public company, ran 98 posts over three months, reached 1,838 people outside the firm, and matched 55 of them to its own target account list, with another 202 C-level people from companies outside that list. A two-founder trading startup started with almost no audience at all. Within a month, the largest company in its industry, its single most important buyer, went from 10% to 14% of one founder's readers. Same method, three very different results, and that is what a metric is supposed to do.
What stays the same is the cost of measuring the wrong thing. The content did not fail in any of these cases. Its output was invisible in the format everyone was looking at. Every one of those companies had the signals. None of them had a report that showed them. So the next question is what that report looks like.
Four numbers
Here is what we put in a monthly report now. Four lines, and they fit on one slide. Each one is a count of the signals from the previous section, rolled up to the level finance reads.
- Target accounts touched this month. Sales and finance already count in accounts, so this number needs no translation.
- Of those, new this month. Shows whether reach is expanding or recycling the same people.
- Accounts touched two or more times. Repetition you cannot buy with ad spend.
- People with a buying title among them. Answers the question "are these even the right people".
The fourth line matters more than it looks. In our measurement a quarter of a typical B2B audience holds a buying title, meaning C-level or vice president and above once you remove people who sell services. Your share will differ, and the point is to know it. If it is far below what you expected, you have an audience problem, and posting more often will not fix it. I once had to answer a client who was unhappy with the number of likes on his posts. The answer was that a post with 80 likes from directors is worth more than a post with 500 likes from anyone. The fourth line is how you show that with numbers instead of an argument.
The third line is the one that starts conversations with sales. In the same measurement, 406 people with buying titles came back to two or more posts from the same author. A named executive at a target account who came back three times this quarter is a different object than an impression. Everyone at the table understands that immediately.
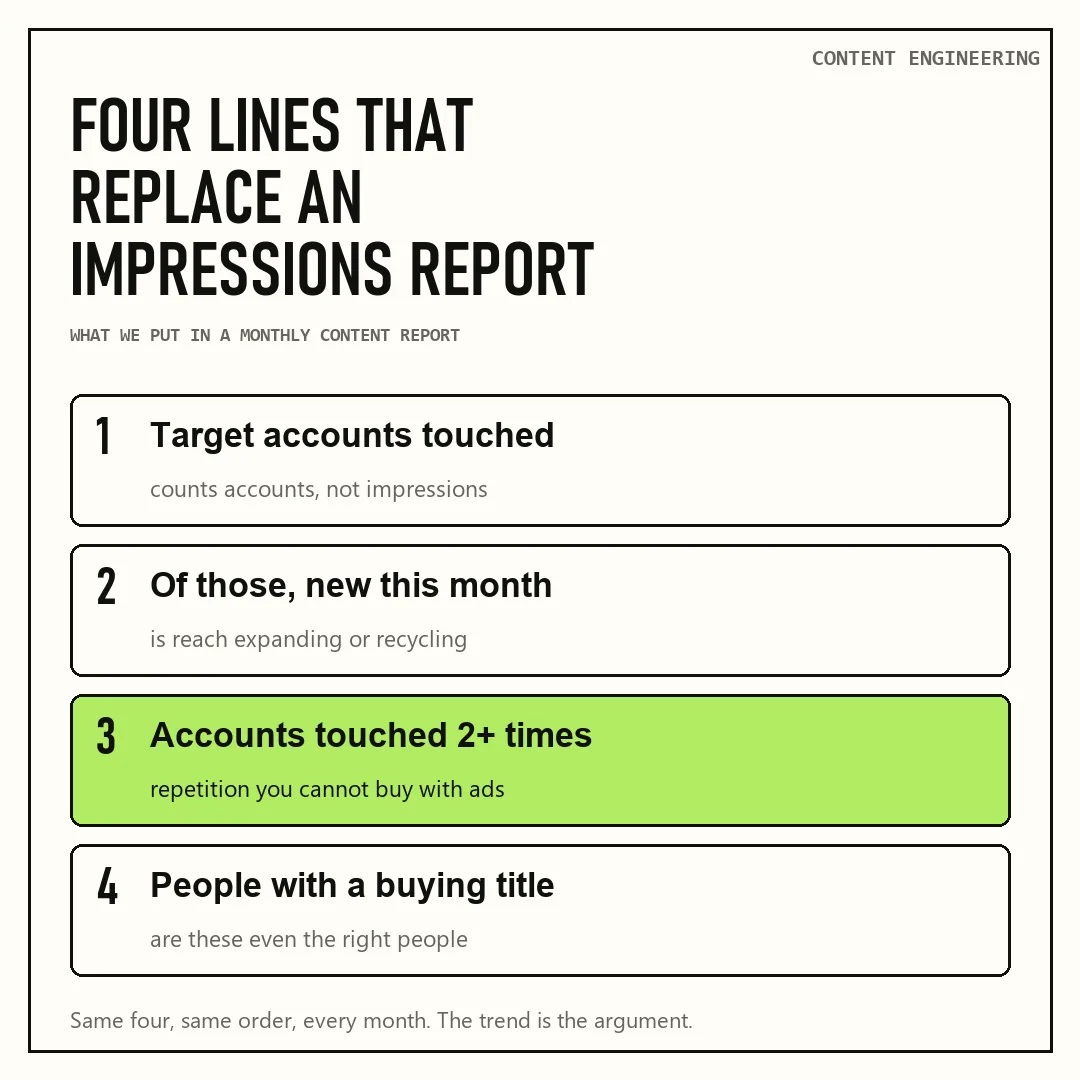
What a monthly content report looks like when it counts accounts. Our own format.
The four numbers are simple to read. Producing them is the work, so here is the work.
Building it
Six steps. None of them are clever, which is the point.
- Use the sales list, not a marketing list. Your target accounts and the named people inside them, exactly as sales has them. If the two lists differ, your numbers will never reconcile with the CRM and the whole exercise dies in the first meeting.
- After every post, pull the audience. The people who reacted and the people who commented, with their profile links. For one post this is a couple of minutes by hand. For a year of posts it is a scraping job, and the raw data costs a fraction of a cent per person.
- Match on company first, person second. Company match produces the account number. Person match produces the buying-title number. Budget real time for this step, because company names do not match cleanly: subsidiaries, rebrands, acquisitions and plain spelling differences turn one employer into three. Keep an alias table from the first month and it stops being a problem.
- Roll people up into accounts, with a denominator. Finance counts accounts. Three people from one target company in a month is one account touched, three times. And put the account size next to it. "31 of that company's 4,000 employees engaged, 6 of them more than twice" is a slide. "Some people from that company showed up" is not.
- Write it into the CRM. Two fields on the account record: date of first content touch, and number of touches. This is the step teams skip, and it is the step that makes the metric survive a leadership change.
- Report the four numbers monthly. Same four, same order, every month. The trend is the argument, not any single month.
Steps 2 and 3 are manual for a list of twenty accounts and impossible for a list of five hundred. That is where tooling comes in. I will come back to it at the end.
Once the four numbers exist, you will present them, and the first presentation is where most of these reports die. The next two sections are about surviving it.
The three objections you will get
This report gets challenged the first two times you present it. The questions are always the same three, so have the answers ready.
"An intern at a target account liked a post. That is not coverage." Correct, which is why the fourth line exists. Report accounts touched and buying titles separately, never blended into one flattering number. If the buying-title share is low, say so out loud before someone else does. A report that volunteers its own weak spot survives. One that hides it gets audited.
"How is this different from ad impressions?" Two differences, and both are checkable. The people are named, so sales can look at them one by one. And they chose to act, which nobody does with an impression. You can hand a rep five names at their account and they can open each profile. You cannot do that with a reach number.
"Prove it moved revenue." Do not take this bait. The answer is that you are measuring coverage, the same way the ABM programme next door measures coverage, and that the alternative currently on the table is impressions. If someone insists on a revenue line, offer the one honest version. Take the deals that closed this year, look backwards, and count how many of those accounts appear in the coverage data before the first meeting. That is a lagging, correlational number, and it should be presented as exactly that.
One more thing, learned the expensive way. Set the reporting window before you see the data and never move it. Choosing windows that look good turns the report into marketing about marketing.
Answering the objections is half of it. The other half is not handing anyone a reason to doubt you.
What you must not claim
This part is about keeping your credibility, so be strict with yourself.
Coverage is not attribution. You are showing that named people at target accounts encountered you repeatedly. You are not showing that this caused the deal, and if you say it did, the first analytical person who reads it will take the whole report apart. In our own client contracts the split is explicit: touches and coverage are what we commit to, leads and deals are what we track, and nobody guarantees the second.
The honest sentence is short: these accounts saw us this many times before they arrived. That is enough. Nobody has ever cut a budget because a coverage report was too modest.
Be strict about warmth too. Someone liking your post is not a relationship. If a person corresponds with you, it does not mean you have warm relations. They can forget you in a day. Coverage tells you where the attention is, and the work of converting it still has to happen.
That is the method: the signals, the four numbers, the six steps, the three answers and the one claim you never make. What remains is where to start on Monday.
Your first month, without buying anything
Do not start with a platform. Start with twenty accounts.
Take the twenty target accounts that matter most this quarter. For each one, open the like and comment lists under your last quarter of posts and note every person from those companies who appears. It is an afternoon of work.
Then bring that list to your next meeting with sales, instead of the reach chart. Watch what happens when a rep sees a named person from an account they have been chasing for five months sitting in your audience since March.
That reaction is your proof the metric is right. Everything after it is scale, and scale is where we come in.
What we do with this
I should be direct about our own position, because I am describing a thing we sell. Factor that in.
At cccrafts we built this into a system, and every case in this article came out of it. It tracks about 60,000 LinkedIn authors every day and holds more than 900,000 of their posts. Point it at any profile and it pulls the full audience behind the posts, looks up every person, sorts them by company and title, and matches the result against a client's target accounts. The same system runs the other direction: it finds where those people are already talking and drafts comments for our client to leave there. A human approves every comment before it goes out. Nothing is published blind.
So when a client asks who from their ICP touched their content last month, the answer is a list of names with companies next to them. That is the change, and it is why the monthly report stopped being an argument and became a handover to sales.
If you want to know what your own coverage looks like, write to me and we will talk about your accounts and what it would take. Message me at linkedin.com/in/sbulaev or through cccrafts.ai.
Content Engineering is a newsletter by cccrafts. We build and run content systems for B2B companies.
Serge Bulaev is the CEO and founder of cccrafts, where the team builds and runs content systems for B2B companies. He writes Content Engineering, a newsletter about the data, automations and costs behind content that reaches the right buyers.